Price Targets
Over time, stocks tend to move in predictable patterns. Our Price Target chart analyzes prior price movements and projects potential areas of support and resistance into the future.
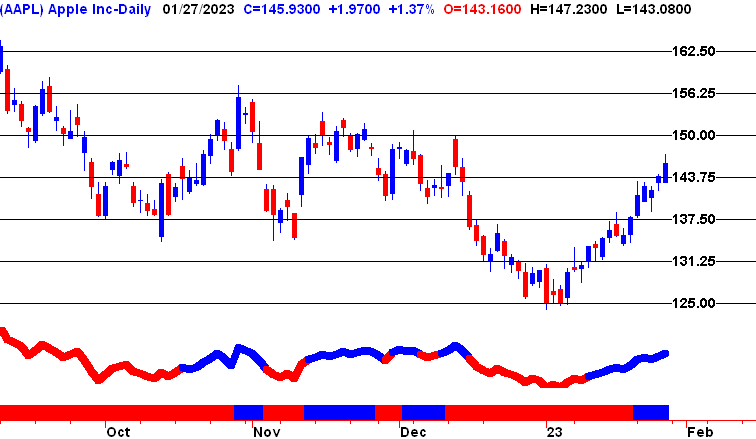
In this example, we can see that if Apple continues to move higher it should find resistance at the following price points.
150.00
156.25
162.50
Move ahead 2 months and we resistance and then support at these price points.
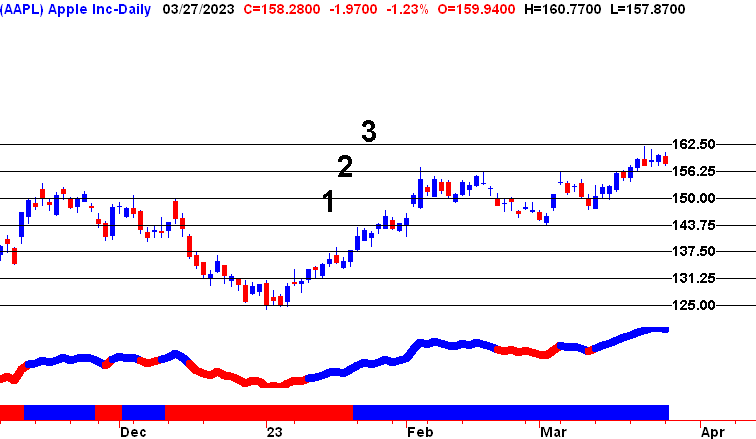
Looking ahead, if we break down below the recent low at 143.75, then the following price targets become potential areas of support.
137.50
131.25
125.00
For longer-term investors we also provide weekly Price Target charts.
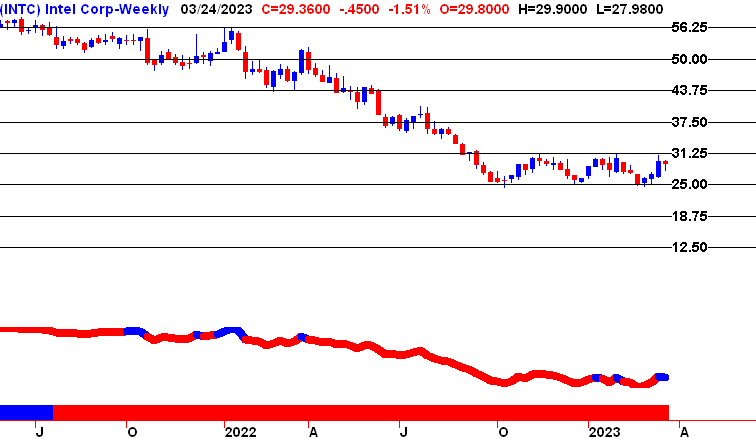
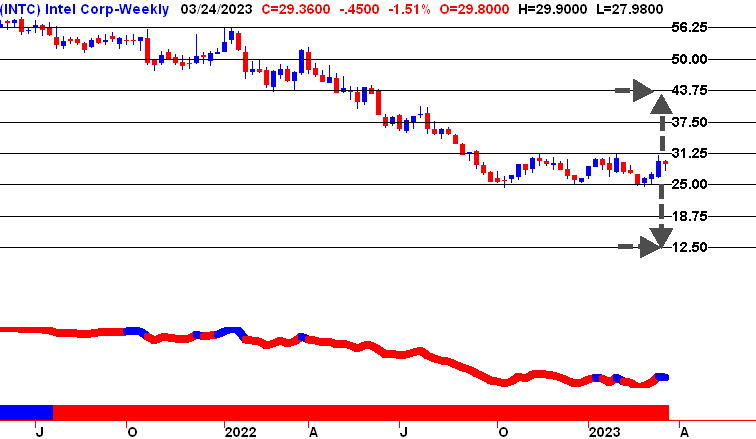
Anytime we are looking at a price target chart, we start by including just the first two lines up and the first two lines down from wherever were currently trading. We call this our playing field. While stocks will periodically hit home runs, for the most part, a stock moves one or two lines at a time.
In this example, we would look two lines up and two lines down.
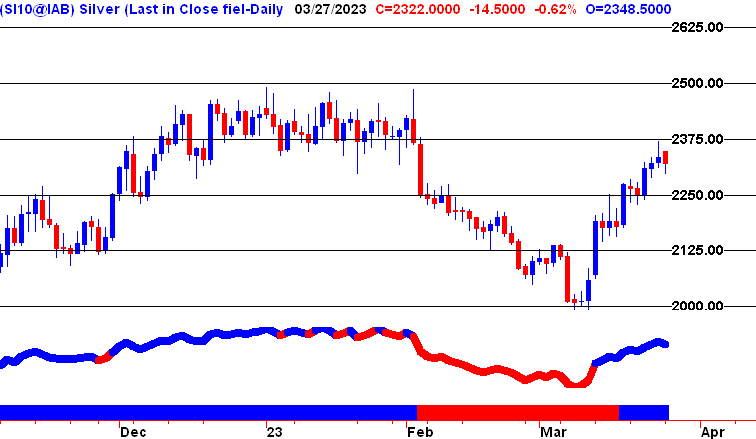
Our price target charts also work on futures contracts.
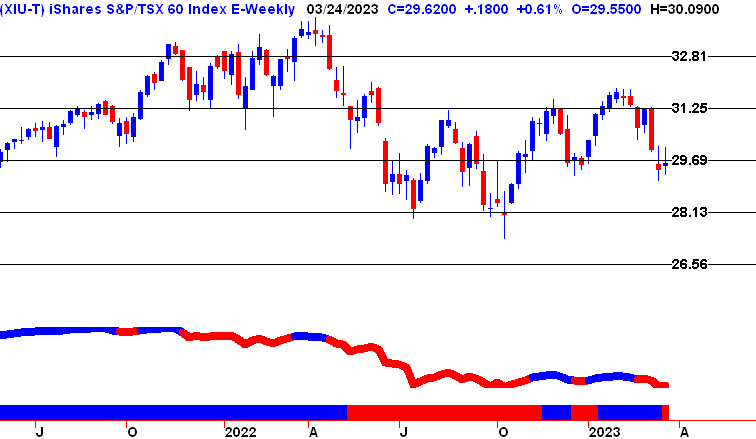
And exchange traded funds.
As part of our Right Side Trading System, we take partial profits at each price target line when we are either going long or going short. These orders are placed once the initial buy or sell order has been confirmed.

