Average True Range
The Average True Range (ATR) indicator is a technical analysis tool that measures market volatility. It was developed by J. Welles Wilder Jr. and is used to determine the average range of price movements for a particular security over a given time period. The ATR is calculated by taking the average of the True Range (TR) over a specified number of periods.
The True Range is the largest of the following three calculations:
The distance between the high and low of the current period.
The distance between the previous close and the current high.
The distance between the previous close and the current low.
The Average True Range (ATR) indicator can be presented in a dollar amount or as a percentage.
Traders can use the ATR in a few different ways:
Volatility measurement: The ATR can help traders to identify how volatile a market is. A higher ATR indicates that the market is more volatile, while a lower ATR indicates that the market is less volatile. This information can help traders to determine their risk tolerance and adjust their trading strategies accordingly.
Setting stop-loss levels: Traders can use the ATR $ to set stop-loss levels that are proportional to the current market volatility. For example, if the ATR is high, a trader may set a wider stop-loss to account for the increased volatility, while if the ATR is low, a trader may set a tighter stop-loss.
Position sizing: Traders can also use the ATR % to determine their position size based on the current market volatility. A higher ATR indicates that the market is more volatile and may require a smaller position size to manage risk, while a lower ATR may allow for a larger position size.
At TheUptrend, we use the Average True Range (ATR) indicator as a percentage to help compare different opportunities. A stock with a lower Average True Range % has less risk but also less opportunity for capital gains. A stock with a higher Average True Range % has more risk but also has a higher opportunity for capital gains.
Here are a couple of examples.
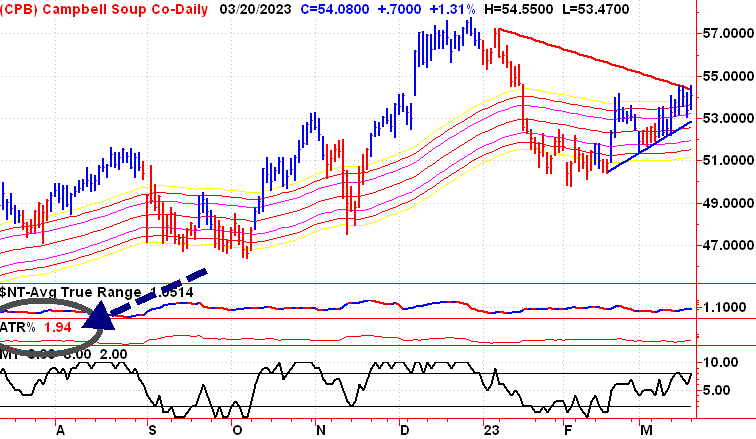
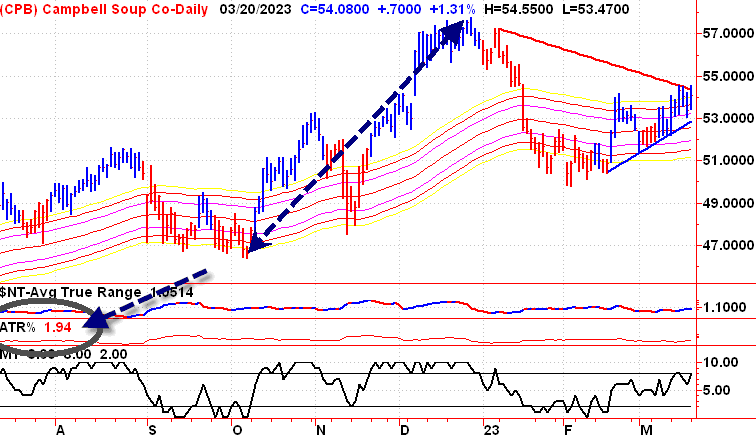
Campbell Soup is a household brand name with a relatively low Average True Range %.
Currently, the ATR is just 1.94%.

This tells us that this stock is not very risky, but at the same time the opportunity for capital gains is relatively low. We can see this by looking at the move from the recent low the recent high was a move of 24.4%. 24.4% sounds great until you compare it to a stock with a higher ATR %.

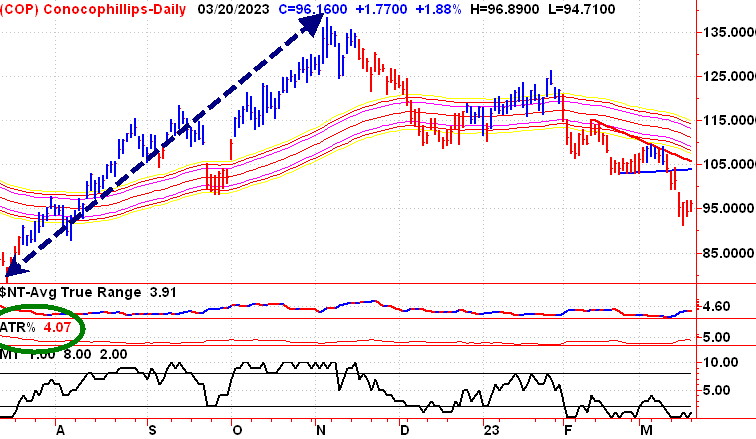
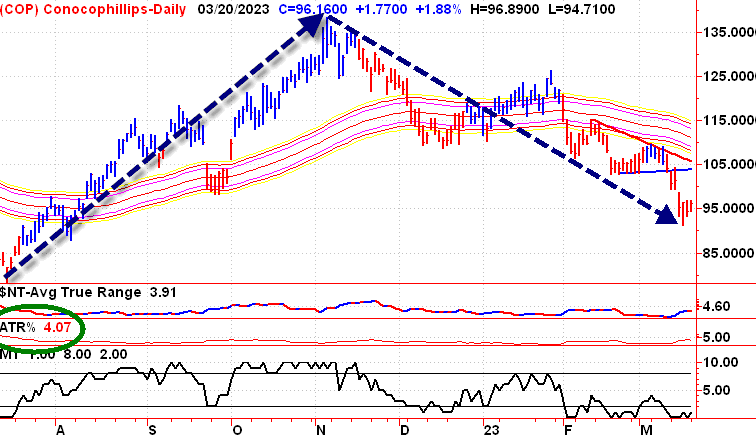
How does that compare to another stock that starts with the letter C? If we look at Conoco Phillips, it currently has an Average True Range % of 4.07%. More than double the current ATR for Campbell Soup. Our assumption based on just this number and not looking at the chart is that this stock would be much riskier, but have a much higher potential for capital gains. Let’s see what recent trading activity tells us.
Measuring the move from the low on the left-hand side of the chart to the peak, Conoco Phillips gained 76%.

Of course there’s the other side of the coin. A stock with a higher ATR also has a bigger potential for capital loss. In this example measuring from the peak to the recent low Conoco Phillips lost 33.9%.

This is just an example to highlight the differences between a low ATR and a high ATR. Typically investors wouldn’t compare these two stocks at the same time.
ATR fluctuates over time and stocks often move from periods of low volatility to periods of high volatility.
Each sector of the market has its own ATR range.
Biotech, Commodity, and Technology stocks generally have the highest ATR.
Historically, the least volatile sector of the S&P 500 has been the utility sector.
The utility sector consists of companies that provide essential services like electricity, gas, and water. These companies are often regulated and have stable, predictable cash flows, which can make their stocks less volatile than those of other sectors.
Overall, the ATR is a useful tool for traders to gauge market volatility and adjust their trading strategies accordingly. By using the ATR in combination with other technical indicators and analysis, traders can make more informed decisions about when to enter and exit the market and how to manage risk.

