Insects that fly, such as flies, mosquitoes, and gnats, can be caught and killed using flypaper, a sort of sticky paper or material. Usually, it is made of a thin paper sheet or strip that has been covered with glue or adhesive that attracts and traps insects when they come into touch with it. Flypaper is available in pre-made sheets or rolls for purchase, or it can be manufactured at home with basic household items.
We have something similar that can be applied to analyzing the stock market.
Our Flypaper Channel is made up of a series of lines that will expand or contract based on the volatility of the underlying security. The more volatile the security is, the thinner the channel is. As volatility contracts, the channel will expand.
A security trading above the Flypaper Channel is considered to be in a bull market and we would expect the channel to act as support on any pullback.
A security trading below the Flypaper Channel is considered to be in a bear market and we would expect the channel to act as resistance on any up move.
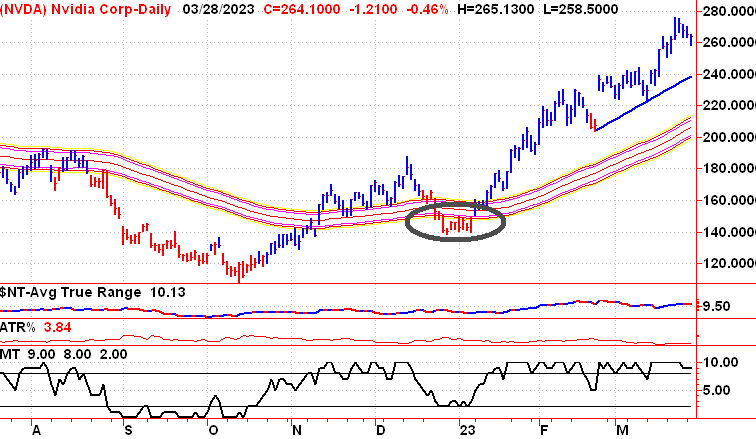
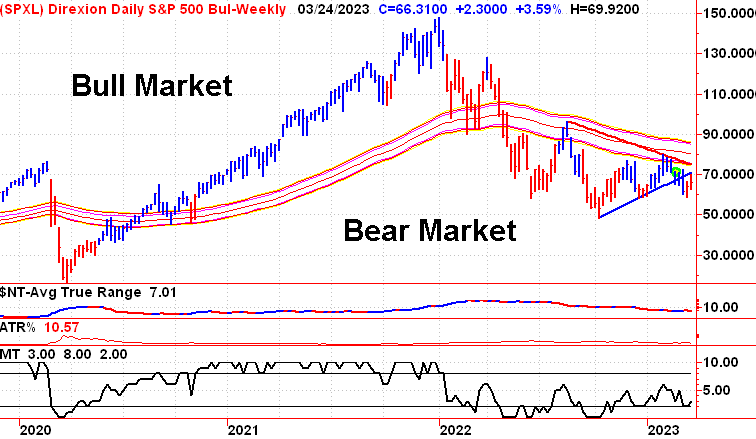
In this example, we can see that the market has tried several times to push this security through the Flypaper Channel.
Again, a security it’s currently in a bear market. Looking at this chart we can assume that the same people keep playing this stock over and over again. We won’t see a breakout above the Flypaper Channel until the security can attract new investors.
It’s important to remember that Flypaper is very sticky.
A security can trade above and below the Flypaper Channel, but unless it starts to physically break away from the channel and become unstuck, our confidence in the new trend starting will remain low.
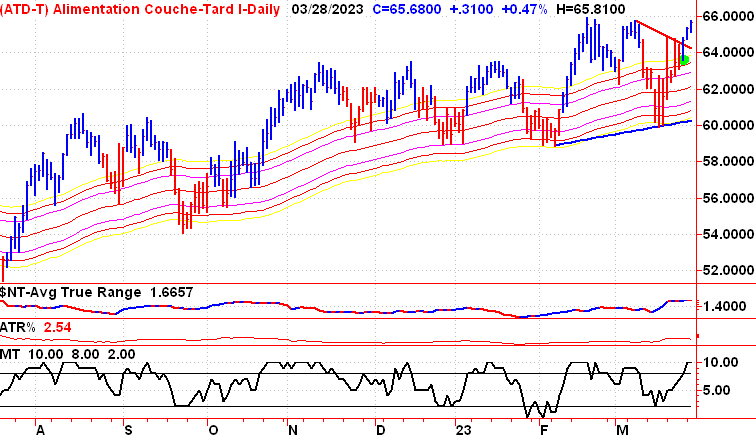
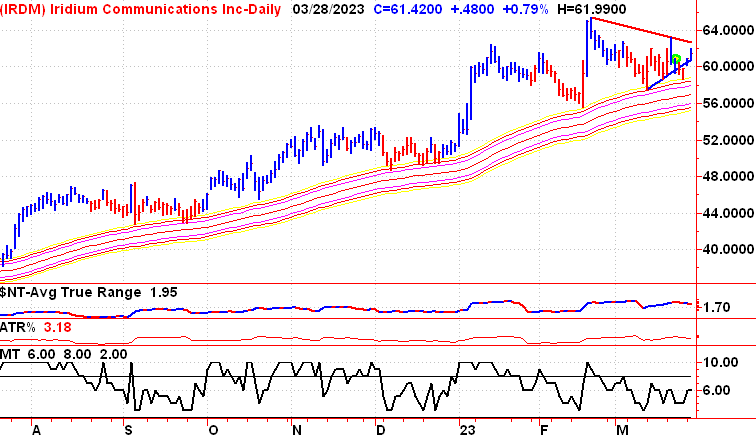
In this example we can see that investors continued to buy every dip for this security. We will be alerted to a significant change in the prospects for the security, if investors stop buying the dips and let it slip below the Flypaper Channel.
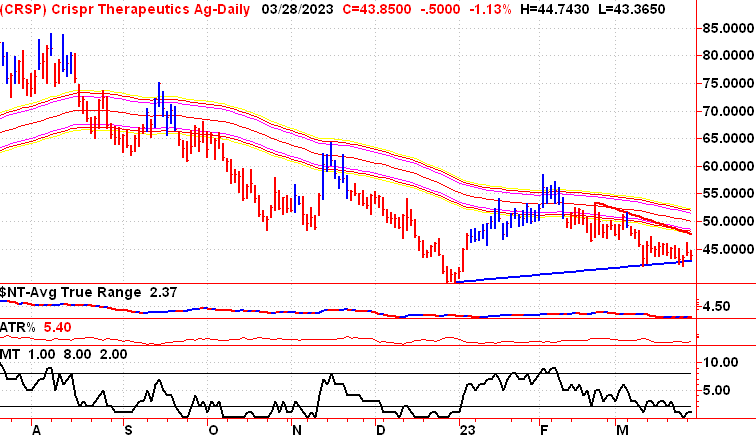
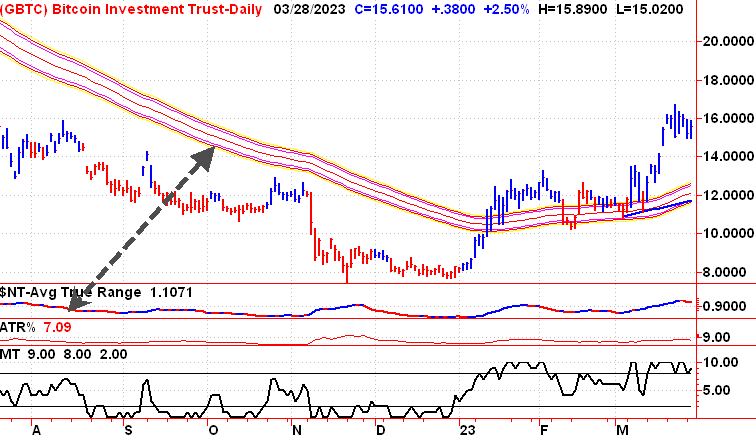
As mentioned earlier, the thinner the channel the more volatile the stock. In this example we see a very thin Flypaper Channel and a very large Average True Range of over 7%
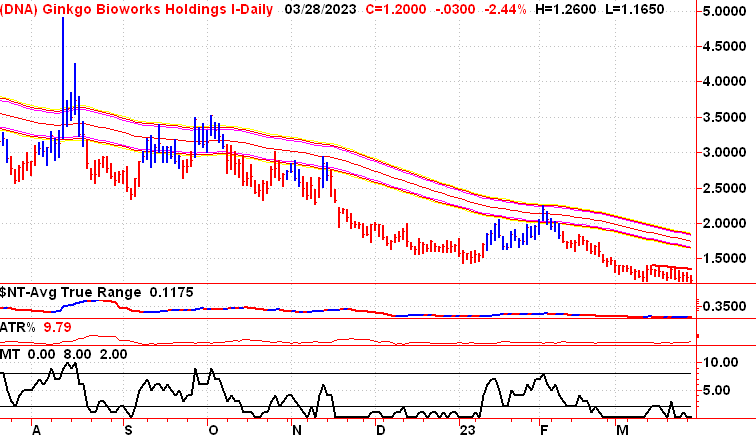
In this example we see the recent movement of approximately 40% in just a couple of weeks.
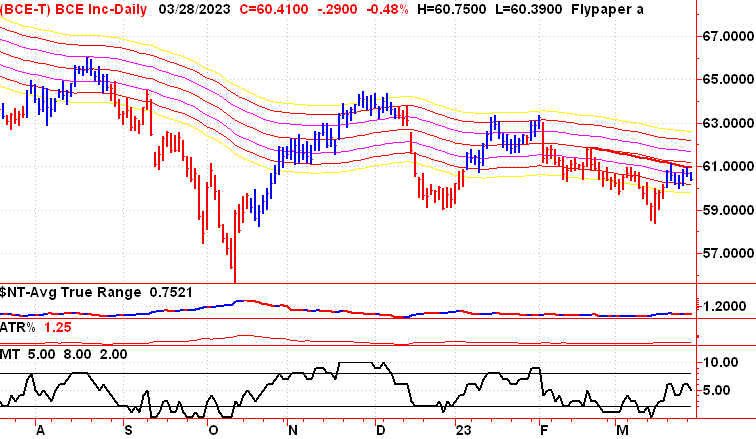
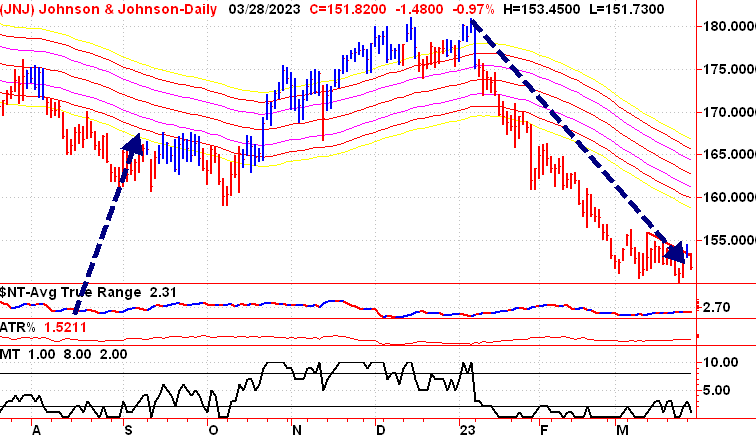
Now here’s an example of a security with a much wider Flypaper Channel that correlates with a much smaller Average True Range of just over 1.5%. In this example during a huge decline, it took 3 months for this security to move down 20%.
For longer-term investors we also provide a weekly version of the Flypaper Channel chart.