
Welcome to TheUpTrend.com: Your Canadian Stock Market Timing Service

Since 2000, Stephen Whiteside and the team at TheUpTrend.com have been at the forefront of helping Canadians navigate the complexities of the stock market, ensuring they stay aligned with major market trends.
Comprehensive Analysis for Every Type of Investor
At TheUpTrend.com, we provide in-depth technical analysis on over 2,200 of North America’s leading stocks and exchange-traded funds (ETFs). Our Canadian Stock Market Timing Service caters to investors and traders of all experience levels:
We currently provide daily coverage on over 450 Canadian stocks and 80 Canadian listed Exchange Traded Funds.
Know when to Buy and when to Sell.
Long-Term Investors
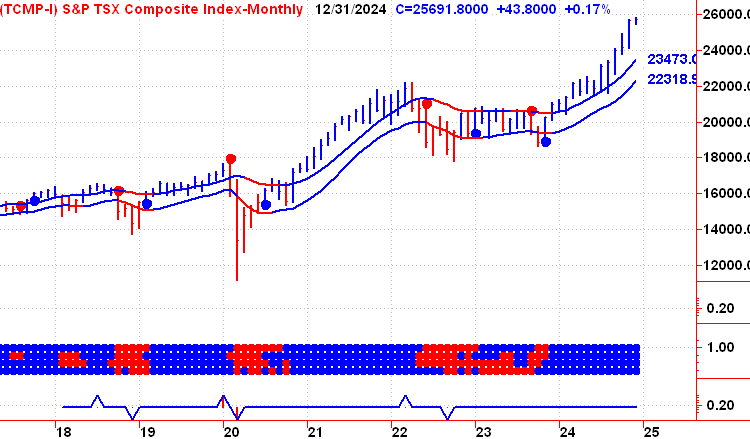
For those who prefer to remain in the market for extended periods, we offer **monthly analysis** that identifies overarching trends.
Active Long-Term Investors
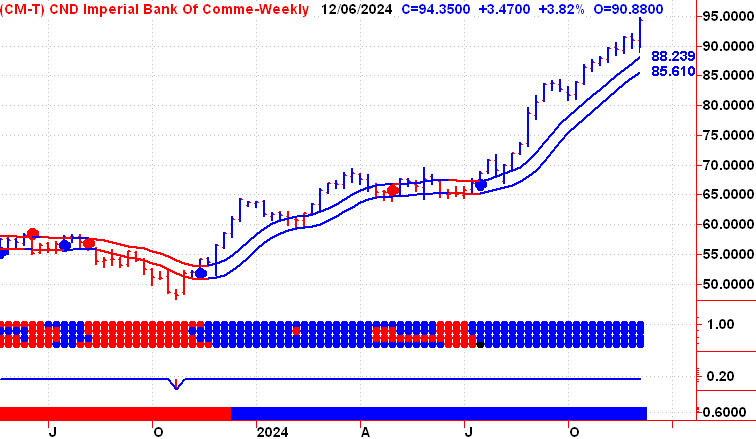
For investors seeking a more hands-on approach, our **weekly analysis** provides detailed insights to fine-tune strategies.
Short-Term Traders
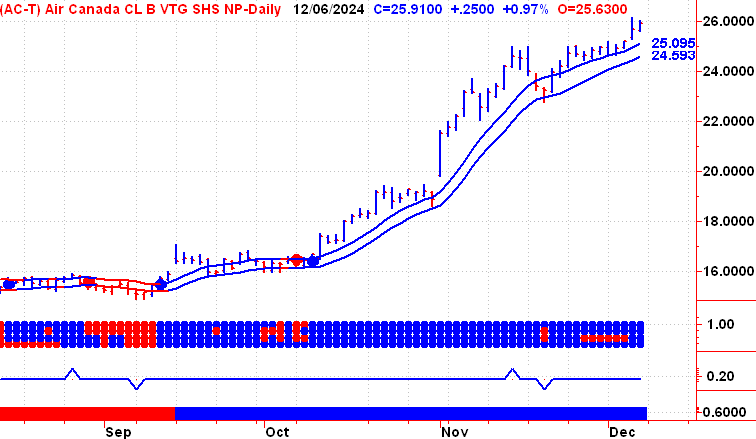
For those who thrive on fast-paced market activity, our **daily analysis** delivers actionable data to help capitalize on quick opportunities.
Understanding Who’s in Control
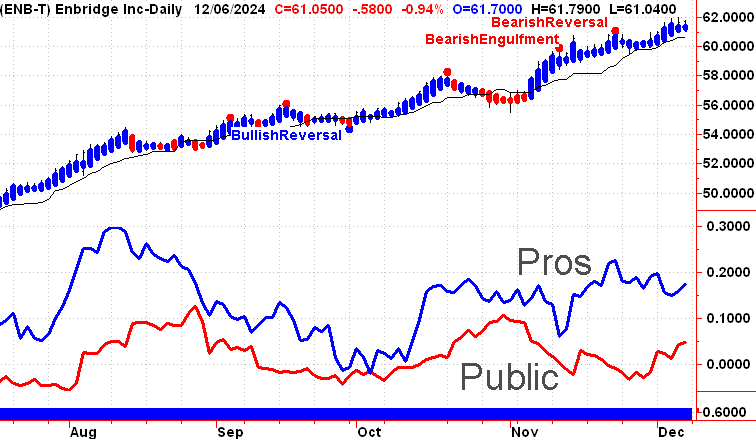
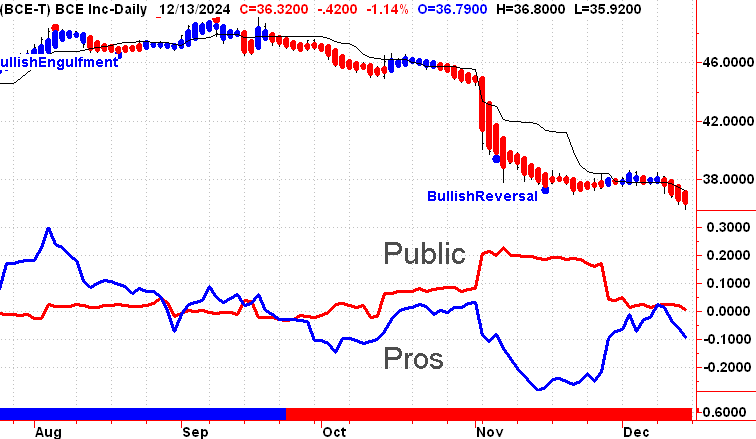
For every stock in our database, we determine whether the **Pros** or the **Public** are in control. Why is this important? It’s much easier to succeed when the Pros are driving the action.
And what happens if you don’t follow the Pros?
Accurate Price Targets You Can Trust
Our precise price target analysis sets us apart. Stocks often move predictably to price target levels, giving you a clear roadmap for potential gains.
Take **CIBC** as an example:
Typically, stocks move 2 Price Target Lines at a time.
– On **November 4**, we identified price targets leading to $93.75.
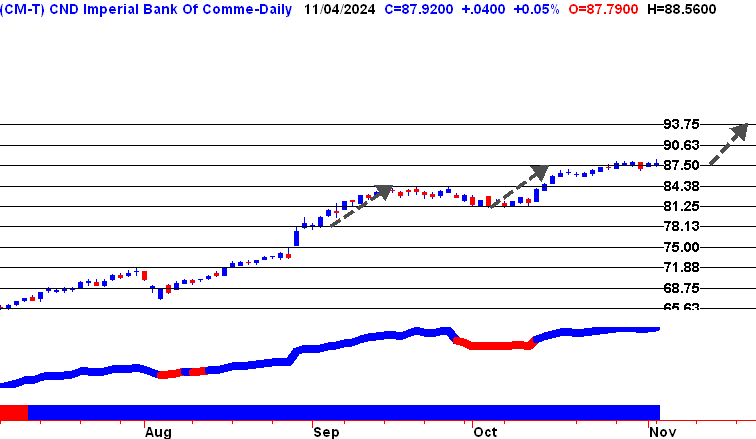
– Just one month later, the stock hit that target, prompting us to update and expand the next set of targets.
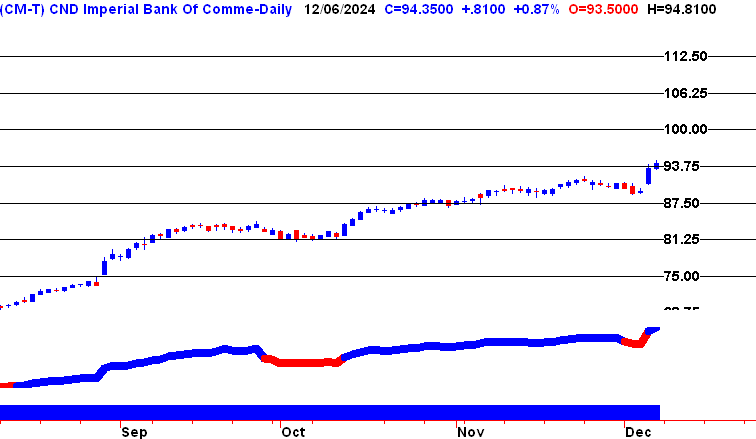
If CIBC can breakout above $93.75, then $100 is our next long-term target.
Life Lesson – Follow Stocks The Market Loves
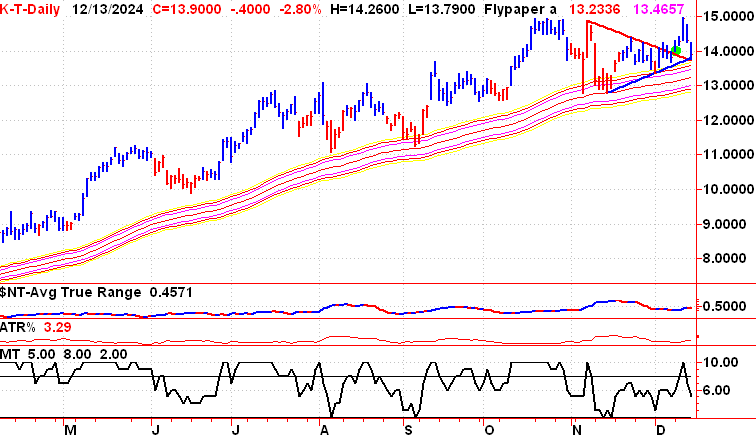
Our Flypaper Channel Charts Show You The Neutral Zone between teh Bulls and The Bears.
It’s easy to see that Kinross investors are still willing to buy any dip.
At the same time, MEG Energy investors are using the Flypaper Channel to sell every move higher.
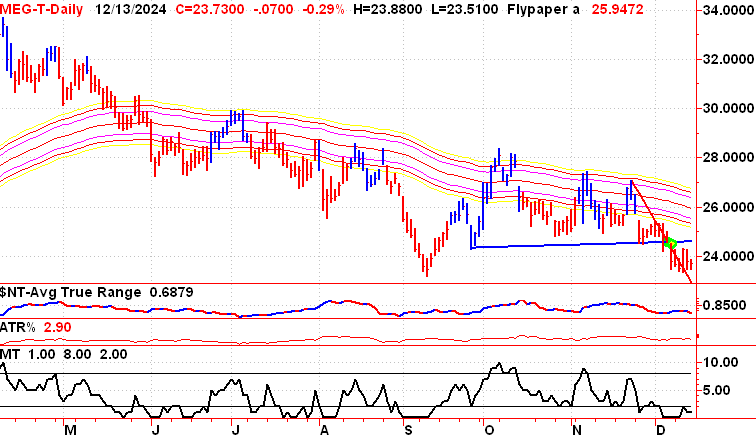
It is easy to see which stock the market loves, and which on it hates right now.
Stick with the stocks the market loves.
On this Weekly Flypaper Channel chart, you can see exactly when Long Term Bank of Nova Scotia investors started to outbid sellers.
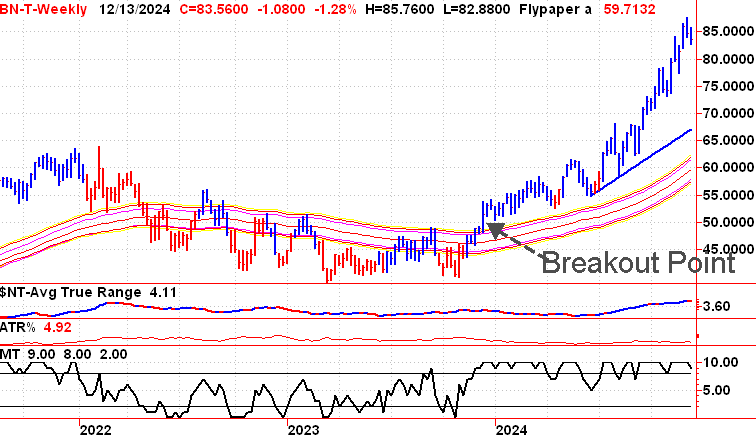
This is just a small sample of our chart library.
For each symbol the database we provide 7 Daily, 7 weekly, and 1 monthly chart.
Depending on the number of symbols are following, we estimate you should be able to manage any size portfolio in less than five as per day
Typically it’s less than 1 min. per day
Let us show you how.
Use Our Charts To Build Your Market Roadmap
Make More Informed, More Timely Decisions
No matter your goals, TheUpTrend.com provides the analytical tools you need to make smarter, faster, and more confident decisions in the market.
Sign Up Today for a Free Trial

Join thousands of investors who trust us as the leading Canadian Stock Market Timing Service. Try us today and discover why we’re considered the best in the business.
