Intermediate Term
The Intermediate Term or Mid Term chart is a stand-alone trading system like the Right Side chart. This chart is designed to look for bigger moves in the market, and is much slower to react than the Right Side chart.
This system was designed in the 1980s and used as our main trading system up until 2000. It was a different time back then. You had to call your broker to place an order and commissions were significantly higher than they are today. So the goal was to trade less often and to go after bigger wins.
We provide it now to assist people who don’t wish to participate as actively in the market. likewise for people who require assistance in eliminating minor, less important market movements.
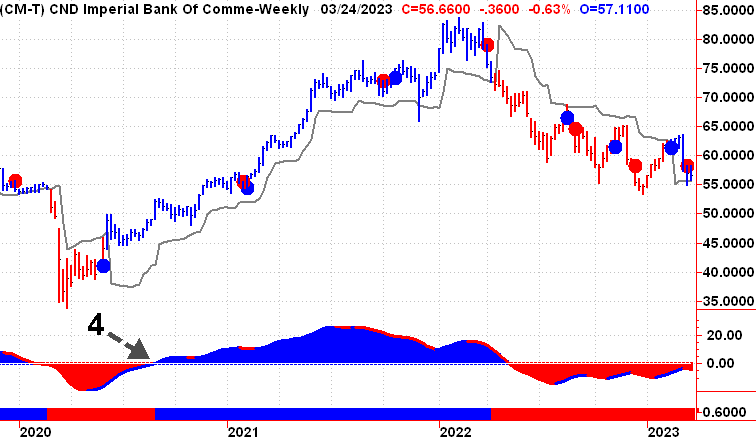
The initial closure above the trend line (1) is a buy signal in this simple to use technique. And a sell signal is generated by the first close below the trend line. The color of the bars on the chart also changes when the trend does. Red bars denote a decline, whereas blue bars denote an uptrend (2).
This chart also presents the very influential Early Warning Signals (3). These signals are also included in our nightly reports
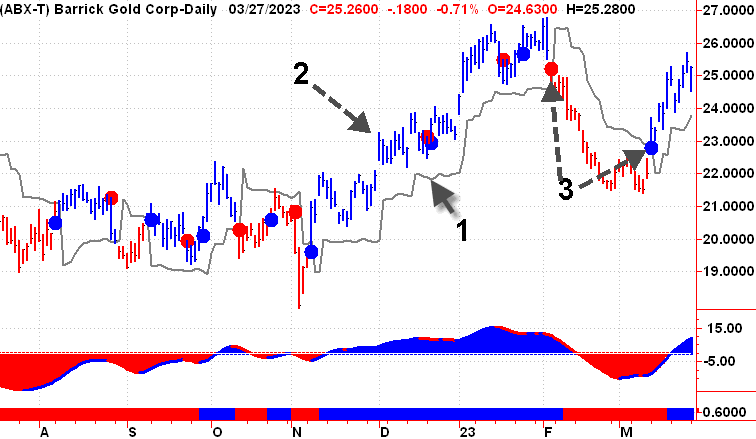
The momentum oscillator is located at the bottom of the screen. When the oscillator is above the center line, also known as the water line, a market is said to be in an uptrend (4). And while below the water’s surface, in a downward trend. This oscillator, like all of our indicators, changes color from red to blue when it’s bearish to blue when it’s bullish.
For longer-term investors we provide a weekly version of the Mid Term Chart.